· Jaroslav Bezdek · Analysis · 4 min read
Age Curves
When do ice hockey players truly reach their prime? Rather than relying solely on external sources, I decided to dive into the data myself. In this analysis, I'll explore the age-performance relationship among hockey players.

A few months ago, I was listening to a podcast featuring a hockey data analyst who mentioned that ice hockey players typically reach their performance peak between the ages of 23 and 24. Shortly afterward, I read the book Stat Shot, in which the author argued that most players peak around age 25, after which their performance begins to decline. After coming across these differing opinions, I thought it would be interesting to create some age curves of my own, and see what the data says.
Performance Metric
We are trying to find the age at which ice hockey players tend to be most productive and when they typically start to decline. Therefore, we need to define what we mean by “performance”. Even though other analysts may use different indicators—such as points per game or goals per game—which could lead to different conclusions, I decided to use “time on ice” as a performance metric.
From my point of view, this metric reflects the decisions made by coaches—the people who know the players best and are in the best position to judge when a player is performing well or not. As such, I believe this metric provides a more accurate picture of a player’s involvement and value to the team than other metrics, such as points per game or goals per game.
Methodology
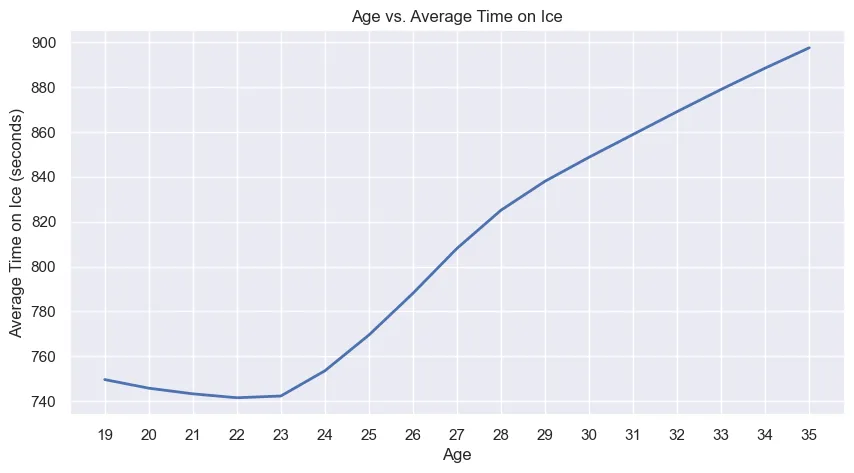
One intuitive way to analyze how player performance changes with age would be to examine the average of a specific performance metric across different age groups and visualize the results. However, this approach suffers from a significant issue known as survivorship bias. In the context of our analysis, survivorship bias refers to the distortion in perceived performance trends caused by only considering players who continue their careers into older age brackets, while ignoring those who retire or decline earlier. What exactly does this mean? Most players retire before reaching their 40s, but exceptional players who continue performing at a high level—such as Jaromir Jagr or Zdeno Chara—skew the results, making the performance peak appear later or the decline seem less steep than it truly is.
If we use average time on ice as our performance metric, the impact of survivorship bias becomes especially clear, as illustrated below:
To mitigate this issue, I applied what is known as the “delta method.” Rather than examining absolute performance values across different ages, I calculated the percentage change in time on ice from one season to the next for each player individually. Next, I averaged these percentage changes within each age group. By comparing each player’s performance to their own prior seasons, this approach significantly reduces the effect of survivorship bias. While it doesn’t entirely eliminate the bias—since only players who survive from age x to x+1 are considered—it greatly diminishes its influence compared to a straightforward age-versus-performance analysis.
Results
So, what do these age curves look like? Below are the results for forwards and defensemen.
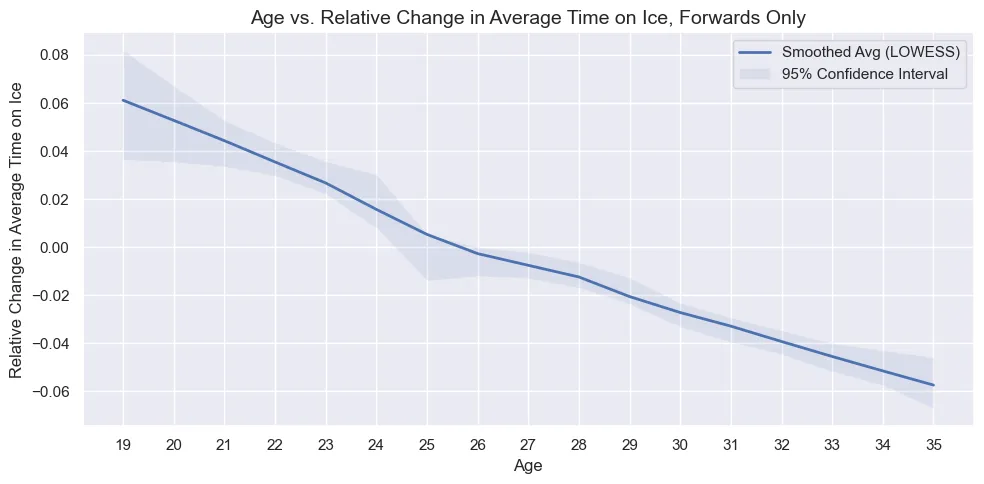
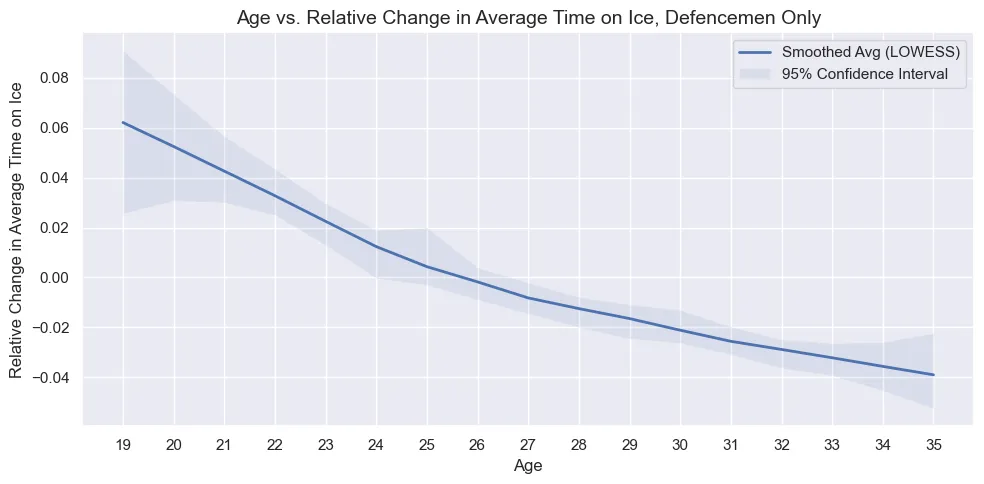
From these visualizations, we can see the following.
- Players continually improve their performance until reaching a peak at around 25 years of age.
- Considering confidence intervals, the performance peak for both forwards and defensemen generally occurs between ages 24 and 26.
- Younger players typically experience larger season-to-season performance improvements.
- After the age of 25, performance decline is slightly steeper for forwards compared to defensemen.
- Confidence intervals are notably wider for the youngest and oldest players, indicating greater uncertainty in these age groups. This also reflects the smaller number of players available for analysis in these ranges.
Based on the analysis, it appears that NHL players reach their performance peak around the age of 25. This is slightly later than the 23–24 age range mentioned in the podcast, so I find myself more aligned with Rob Vollman’s book Stat Shot than with the podcast’s perspective.
Final Message
I hope you enjoyed the analysis and learned something new. If you did, please share it with your friends and colleagues. If you have any feedback or just want to say hi, please reach out to me on LinkedIn.
Thank you for reading! ♥️